Scattering-parameter-parameterization
Scattering Parameters Parameterization
Introduction
Research Focus:
- Inverse problem: given dataset $\rightarrow$ input parameters.
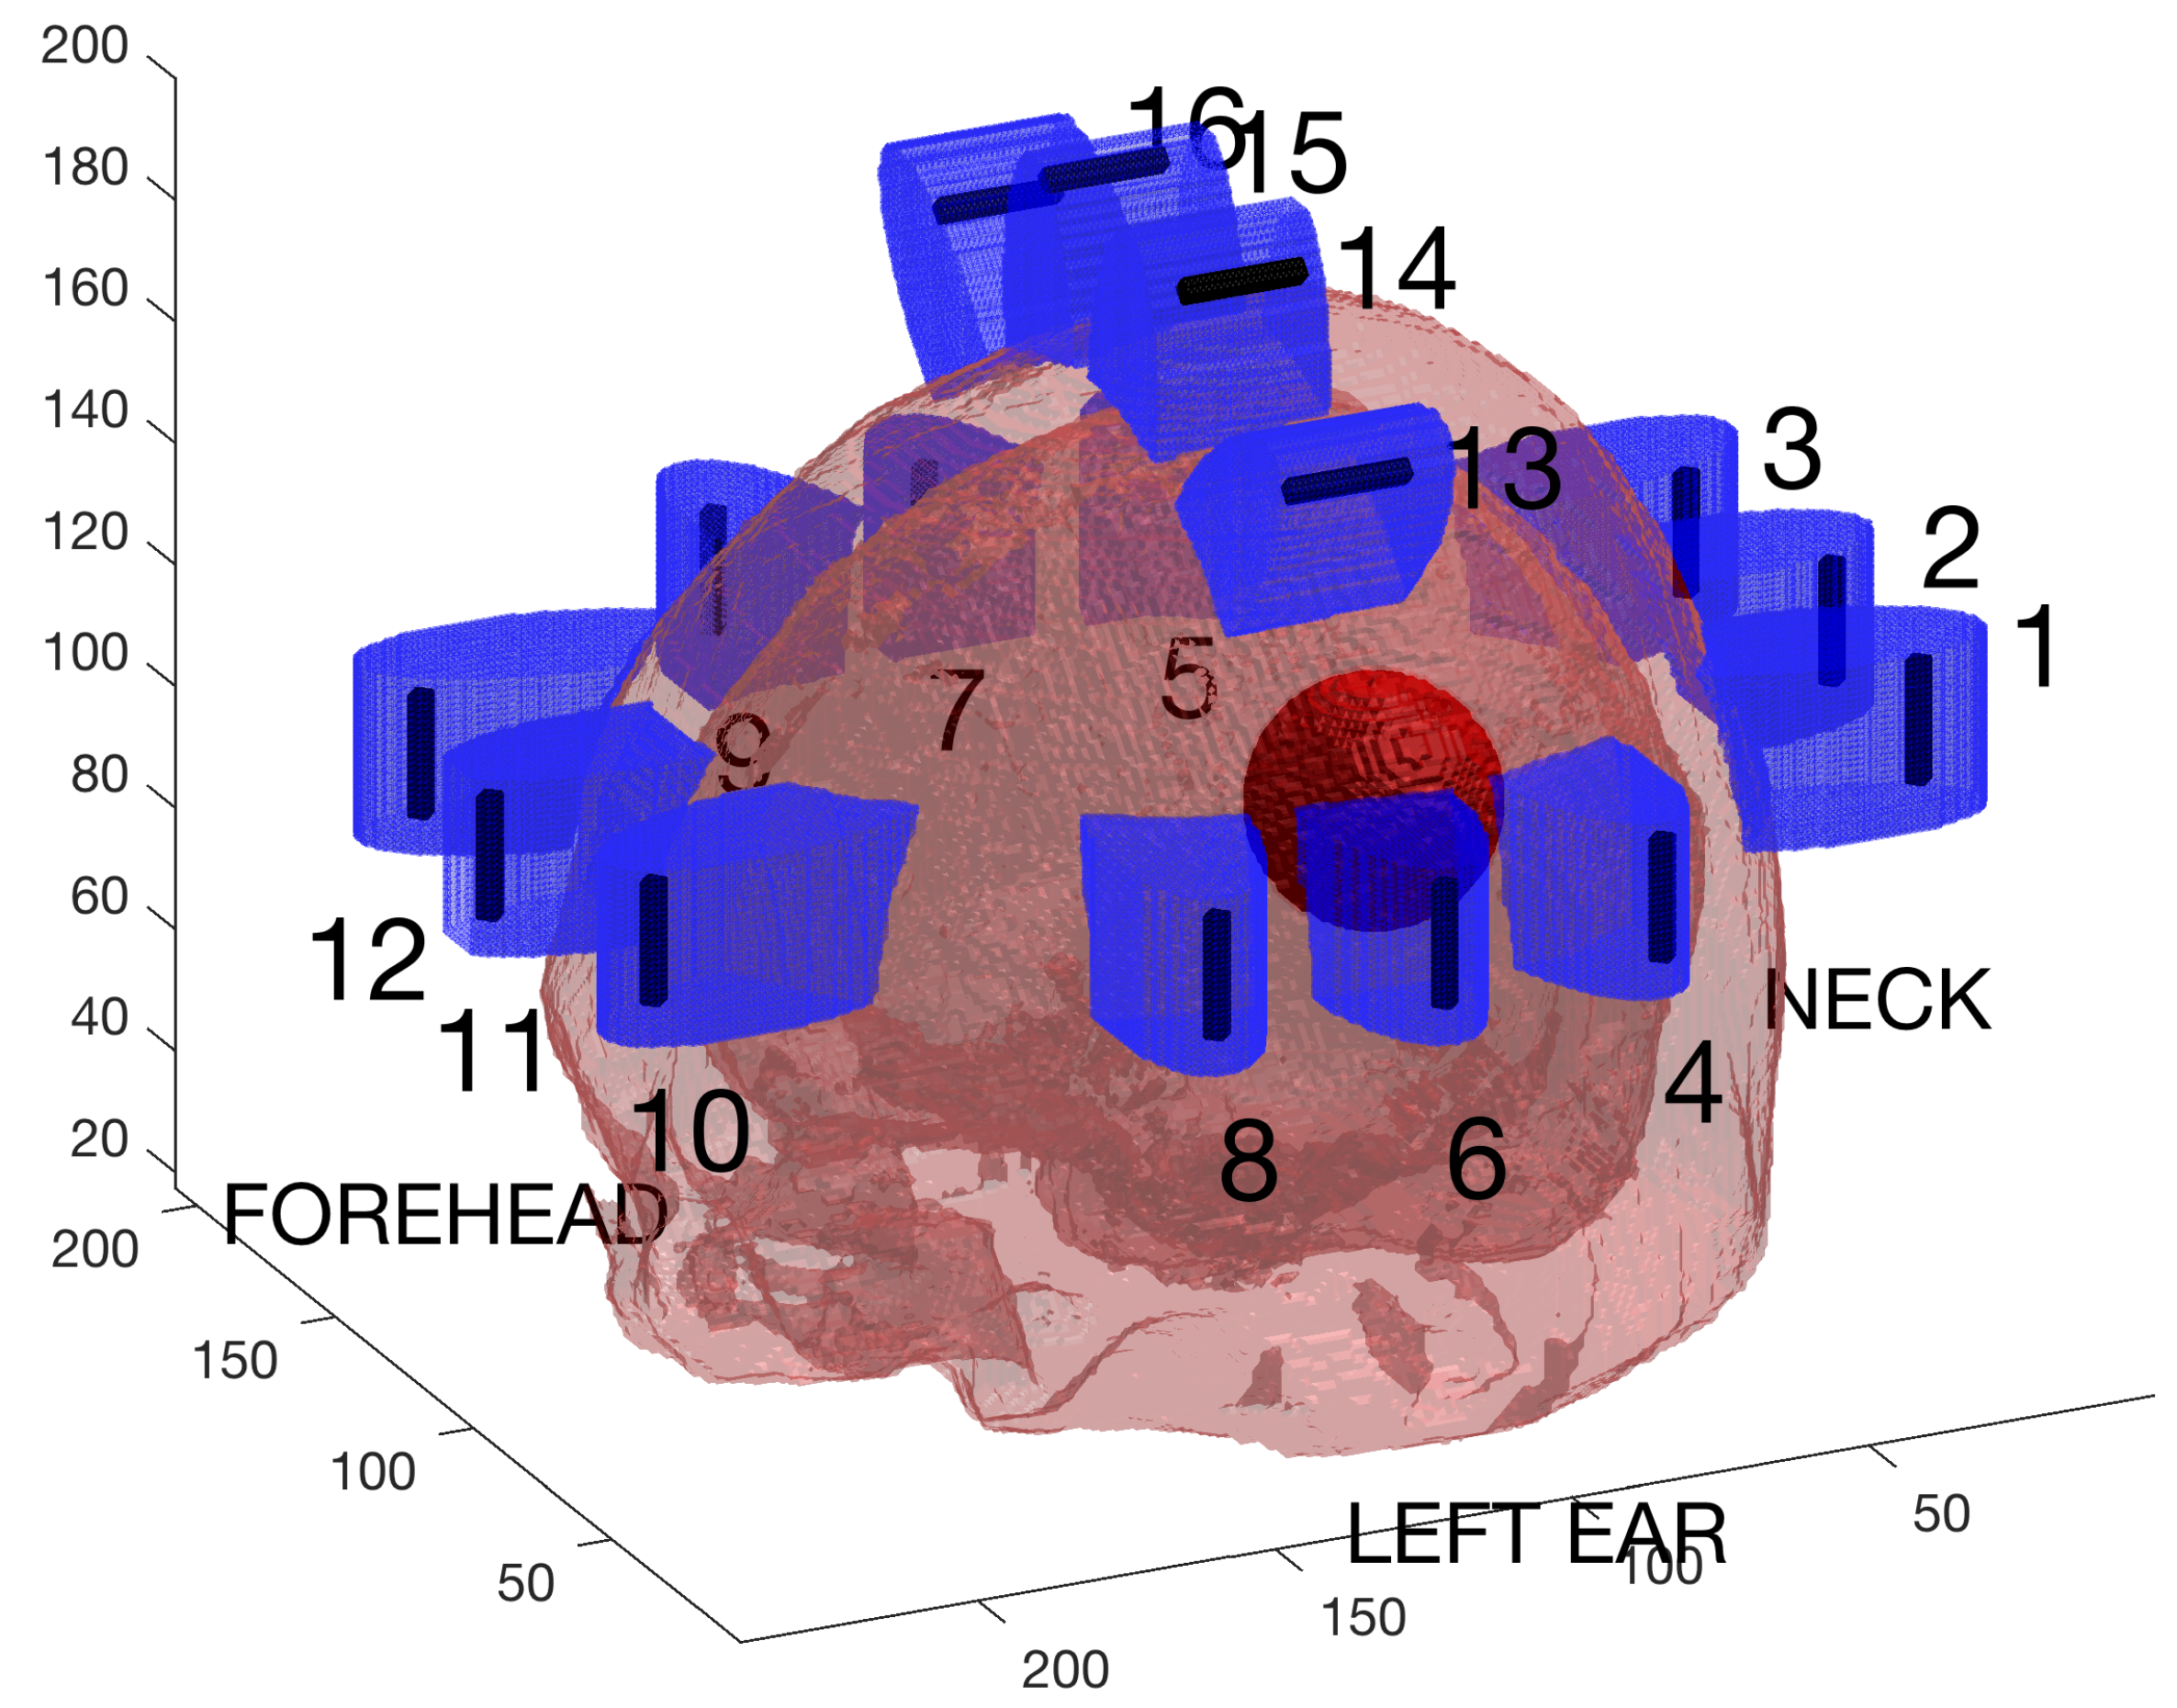
- Simulated microwave transmission data originally used to detect intracranial bleeding after trauma or stroke
 Sixteen antennas were placed around the head model used in the simulations.
Dataset Description:
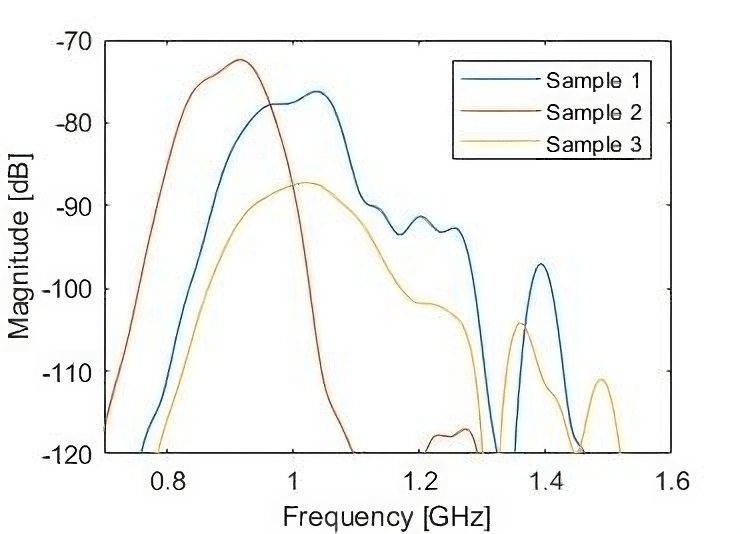
- Scattering parameters (S-parameters) for antenna pairs.
- 1000 pre-simulated healthy samples
- S-parameters from 16 antennas $\rightarrow$ 136 complex-valued curves.
- Antennas 2, 6, 7, 11, and 14 are utilized as amplitude components.

S-parameter $S_{26}$ representing coupling between antennas 2 & 6 for three samples from the dataset.
Input Parameters:
- Rescaling of head in the x, y, & z dimensions.
- Variation in hair layer thickness.
Method
Three Models Employed:
- Basic Feedforward Neural Network
- RNN incorporating a Long Short-Term Memory (LSTM)
- RNN incorporating a Gated Recurrent Unit (GRU)
Shared Network Settings:
- Data split: 80% training & 20% validation.
- Optimizer: Adam
- Loss function: mean squared error (MSE)
- Epochs: 10.
- Batch size: 32.
Multiple Train-Test Splits:
- Iterations: 5.
- Validation with Average MSE & standard deviation.
Results – Single Train-Test Splits
Example of Predicted & True Label of Different Models
| Label | X | Y | Z | Hair |
|---|---|---|---|---|
| Predicted Basic | 0.827 | 0.848 | 0.796 | 0.938 |
| Predicted LSTM | 0.840 | 0.837 | 0.814 | 1.094 |
| Predicted GRU | 0.862 | 0.812 | 0.852 | 0.973 |
| True | 0.844 | 0.851 | 0.834 | 1.0 |
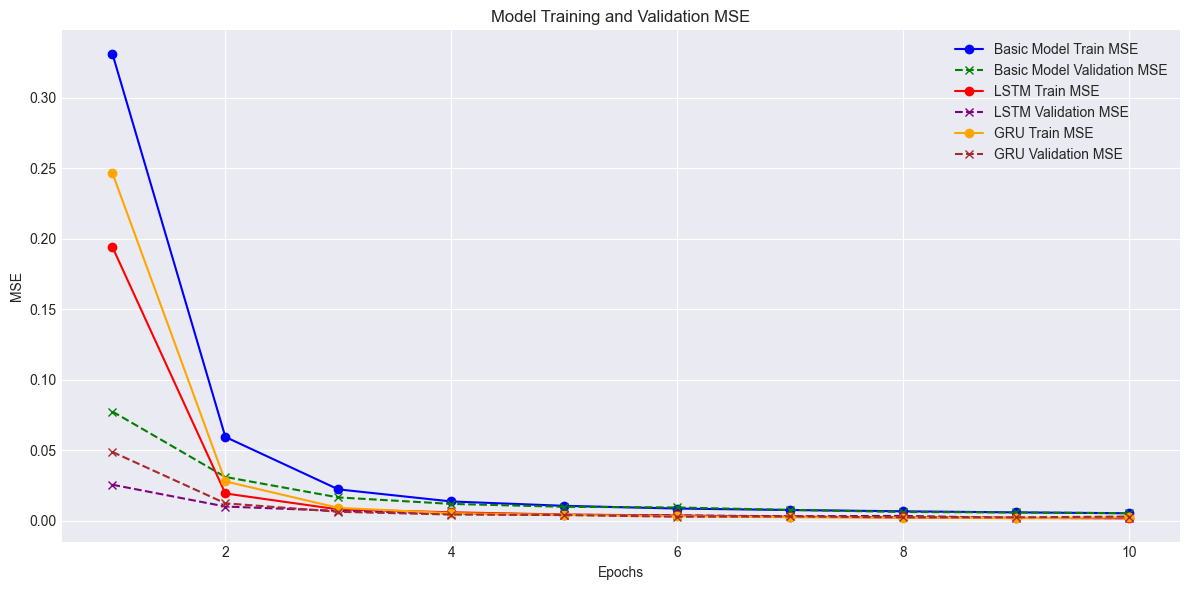
 Training & Validation Results for Different Models
Certainly, here’s the information organized into tables:
Training & Validation Results for Different Models
| Metric | Basic | LSTM | GRU |
|---|---|---|---|
| Training – 1st Epoch | 0.3311 | 0.1941 | 0.2465 |
| Validation – 1st Epoch | 0.0774 | 0.0256 | 0.0488 |
| Training – 10th Epoch | 0.0053 | 0.0017 | 0.0024 |
| Validation – 10th Epoch | 0.0054 | 0.0019 | 0.0030 |
| Metric | Basic | LSTM | GRU |
|---|---|---|---|
| Average Euclidean Distance | 0.1219 | 0.0703 | 0.0925 |
Results – Multiple Train-Test Splits
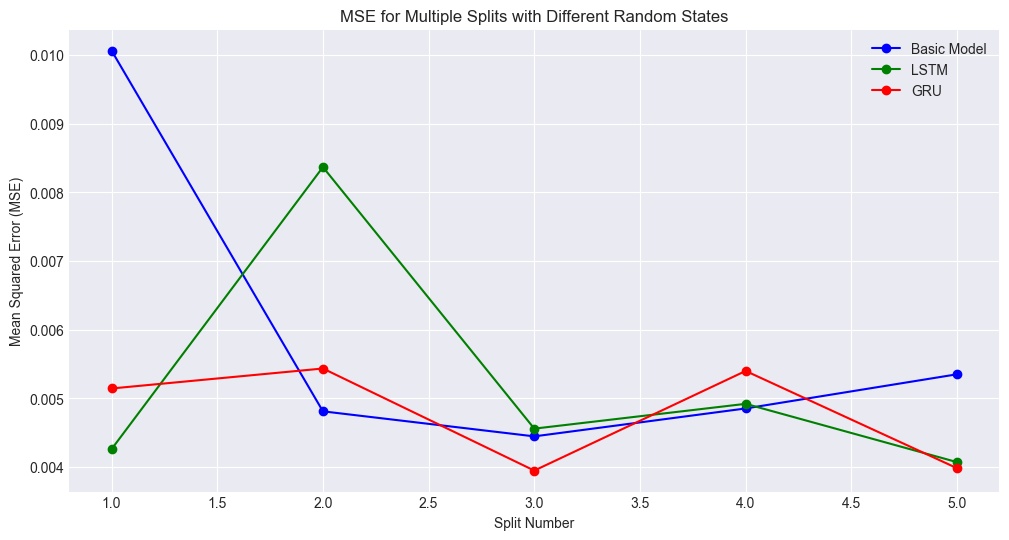
 Validation of Multiple Train-Test Splits
| Model | Average MSE for 5 Splits | Standard Deviation |
|---|---|---|
| Basic | 0.0059 | 0.0021 |
| LSTM | 0.0052 | 0.0016 |
| GRU | 0.0048 | 0.0007 |
- Final result: GRU outperforms LSTM and Basic Model
Prospective Research
- Utilize data from all 16 antennas.
- Dataset contains bleeding samples $\rightarrow$ incorporate these samples.
- Explore data augmentation & transformers.